


[display-name-category]
[post_author]
There may be some users that click one of your ads, and then do research on your website but go away. This same user may later perform another search, find your ads again and end up converting the second time he searched for your website. It is not uncommon that some users might even do a third or fourth search and so on before he/she gets to convert.
The reports found on this part of the interface will provide you with data about how your keywords funneled searches and helped get conversions. These reports go beyond your regular metrics as you are not just using digits; you measure interaction and behavior that leads to conversions.
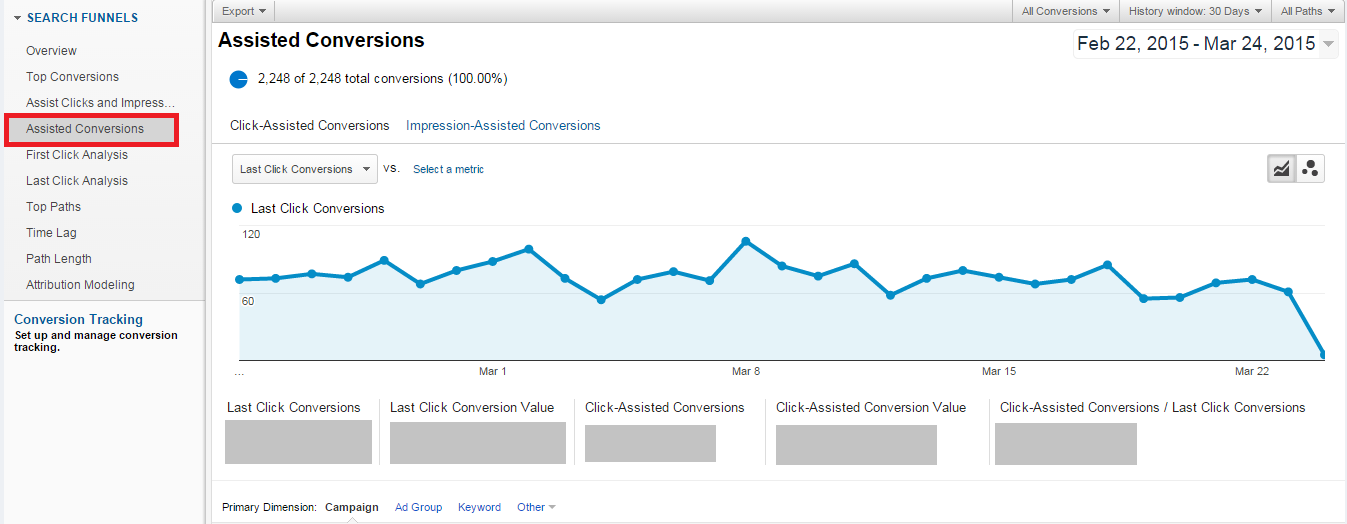
See the Clicks and Impressions That Lead Up to Conversions
With Assisted Conversions, you will be able to see:
- The clicks that lead up to a conversion (these are called assisted clicks) – for each of your keywords
- The number of impressions that were generated leading up to a conversion
Impressions that lead up to conversions are almost as important as clicks because these are not limited to ads that you run on the Display Network. In other words, you will also see this information for ads running on regular Search campaigns.
Seeing what clicks lead up to conversions is a more valuable metric. It is more likely that users that went to your website once or twice end up converting in the long run versus users that only got to read your ads.
Advantages
Your Assisted Conversions prevent you from pausing keywords that may be helping you get a conversion.
Let’s say that you are selling Rolex watches. A keyword like “buy rolex watches miami” may yield a lot of conversions while a keyword like “rolex watches prices” may not get conversions but get qualified traffic. This traffic may be very valuable if it manages to get users interested and to convert after days of the initial click.
In many cases, people pause keywords without analyzing this type of data and consequently end up losing conversions that a specific keyword could have yielded. Analyzing your Assisted Conversions report prevents that from happening.
Disadvantages
Even if you can see that certain elements of your campaign managed to get assisted conversions, it is quite hard to determine if a keyword or ad was truly the inflection point in which a user decided that he wanted to give a conversion on the long run.
Assisted Conversions may lead to subjective thinking as it only telling you that there were one or more clicks at some point in time and then the same user that first clicked ended up converting, it doesn’t tell you what got this user actually convinced . So in a way using assisted conversions may mislead you if that’s the only metric you are taking into consideration.
Pro tip: Always factor in multiple conversions (e.g., contact form submissions, calls etc.). Take into account both your conversions and the assisted conversions, this way you won’t be blinded by a single metric that may make things look better than what they are.
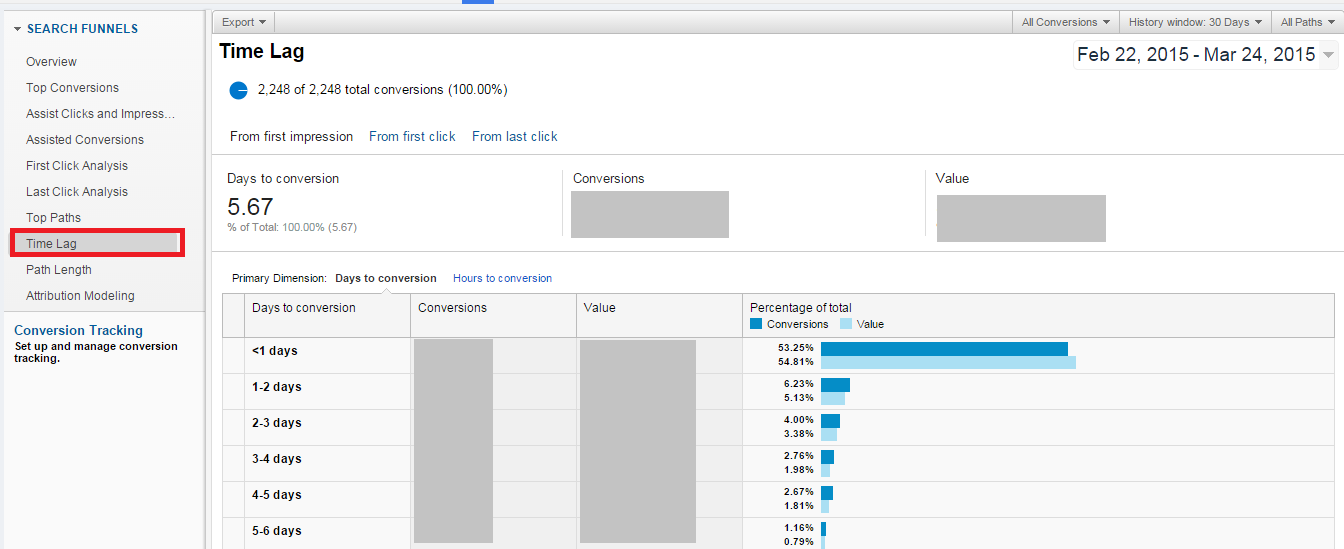
See How Long It Takes To Get A Conversion Using Time Lag
In this report, you can see a breakdown of how many hours or days it took for someone that first clicked on one of your ads to convert.
It works by taking the initial impression or click as a start time and then show you how much time elapsed from beginning to end, in other words, when a conversion was generated.
Advantages
Time lag is great as it allows you to analyze how long it takes for a user that initially visited your site to convert. Time is a very important metric that will help you plan strategically the amount of conversions you are likely to receive in a particular time frame.
For instance, if you see that your products are not being sold on the same day of most of your initial clicks, you could take action to increase or decrease the time frame in which users convert.
One solution could be to come up with time-sensitive promotions to urge them to buy. You could provide a discount that is only available for 48 hours or use the newly added countdown feature in your ads to depict this same promotion in them.
Disadvantages
The main disadvantage is that you cannot break data up with this report:
- You are not able to determine which campaigns, ad groups or keywords are the ones that attract users that take less or more time to convert
- You will only be able to see your metrics at a macro spectrum and not a granular one
See How Many Clicks Or Impressions Were Needed Prior To A Conversion
This report is similar to the time lag report, but instead of measuring the path followed by a conversion in time, you will see it on impressions or clicks.
With it you will be able to know how many interactions someone had with your ads and your website before getting a conversion.
Advantages
This report can even be better than time lag as it allows you to see not the days or hours that elapsed before a conversion but the amount of clicks.
You can use this data in several ways.
One way is that you can identify campaigns where the user isn’t finding what he is looking for when he lands on your website. You can try a new landing page with more information, or write another ad to convert the visitor on the first visit. This will save you money in the long run.
Disadvantages
As this report is very similar to time lag, I have found the same disadvantage in terms of a lack of a granular segmentation of information. Seeing all the information for all your account is good, but as good as seeing it per specific elements and not just averages of a whole.
Use Your Search Funnel To Analyze Your Client’s Data
To sum things up here are some examples of where this report can be beneficial to you and the analysis you need to do for your conversions:
- Breaking down multiple conversion types to identify if conversions are coming more from a contact form, a subscription form, actual sales, etc.
- To know how much time in terms of hours or days elapses between a user first seeing and clicking and ad to them converting.
- To know what progression of Campaigns, Ad Groups or keywords was followed towards an actual conversion.
You can then get creative with the uses and adjust this report to your particular needs. The data found here is awesome, and you simply need to start tapping into the report and browsing through it to know all that’s available.


